Aydrate App
Aydrate is developing a real-time water intake sensor to help athletes which use hydration bags, keeping their performance high and safe using our hydration algorithm.

5.5 Billion US$
*Cost to the American
Tax Payer
500,000
Americans Hospitalize
Per Year
2%
End Up Dead
Yearly cost of dehydration in the U.S.
The idea
The Drinksense product consists of a lightweight sensor that connects to the user's hydration bag and a dedicated application. The sensor, which is connected to the hydration bag, measures the amount of water that the trainee drinks in real time, and transmits information to the application, which presents the trainee with three parameters:
-
The amount of water he drank from the beginning of the activity.
-
The amount of water left in the hydration bag.
-
The degree to which the level of fluid in the body is maintained.
The fluid level maintenance data is calculated by the DrinkSense system algorithm based on the trainee's personal data, exercise intensity and weather data during training. The data regarding the amount of water in real time is transferred from the sensor via bluetooth to an application.
Competitive Research
I’ve looked into different sports apps and hydration apps searching for their weak spots in order to improve the matching engine and search systems.

Run Tracker

Nike

Drink Water

Water Minder
Strong suits
-
Visually clear analysis.
-
Map and clear colors palette.
-
A figure representing the quantity
Water consumption.
Weak points
-
There is no connection between all the statistics.
-
There is no connection between the map and the drinking measurement.

Alex
Innovators
Cyclists who love gadgets and accessories for bicycles.
Posts frequency
2/Day
100$/Gadgets
Average monthly budget
2-3/Week
Riding Frequency
Targeted Video Description:
Focusing on technological innovation, features, design & user experience
Personas

Mark
Improvers
People who like to measure themselves, comparing their results with others and posting them on social networks.
Posts frequency
6/Month
150$/
Performance
Items
Average monthly budget
5/Week
Riding Frequency
Targeted Video Description:
Focusing on the performance achievements that he will get
by using the product

James
Hypochondriacs
People who act by their concerns and use technology as a guide.
Posts frequency
4/Week
1,000$/Health
related Products
Average monthly budget
2-3/Week
Riding Frequency
Targeted Video Description:
Focusing on technological Focusing on the health aspect, protecting the body and well-being
Wireframes and flow

Home

Home / Statistics

Question no. 1

Question no. 2

Question no. 3
Start point

Question no. 3

Question no. 3
End point

Question no. 3
Invalid route

Question no. 3

Question no. 3
Start point

Question no. 3
End point

Question no. 3
Valid route

Question no. 3
Refill tab

Question no. 3
Viewpoint tab

Hydration map and
trail map

Hydration map
The design
Throughout the process, the application is accompanied by Avatar selected by the user during registration through the app. During the registration process the user uploads his personal data and his hydration bag information.
Gender
Body size
Height
Weight
Age
Body fat
Bike specifics
Weight
Hydration specifics
Gear Capacity (L)
Liquid Capacity (L)
Weight
Pack Access
Dimensions
Fit
Features
I chose to work with the blue color palette with touches of orange. The blue represents the concept of water, and implements the idea of drinking. I used eye-catching colors to emphasize the visual data during the sporting activity.

Home page
On this screen you can find the current statistics from the last activity. Everything is set up so you can start enjoying your new upcoming adventure!
Activity page
On this page you can see all the data that the user will need during the sports activity. The amount of water left in the hydration bag, how is his progresses in route and whether
he is hydrated.
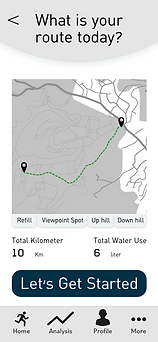
It is possible to see the map by dragging the drop from above. The map has additional data that the user needs during the activity, such as a place to fill up with water and places to stop for a moment and enjoy the view.
